以前作成した箱ひげ図作成ツール PHP-Boxplot を Version 1.1.1 にアップデートしました。
GitHub - macocci7/PHP-Boxplot: PHP-Boxplot creates boxplots using FrequencyTable.
PHP-Boxplot creates boxplots using FrequencyTable. - macocci7/PHP-Boxplot
github.com
インストールの仕方、基本的な使い方については、以前の記事をご覧ください。
主な変更点
▼機能面
- Neonファイルによる設定変更のサポート追加
- 配列による設定変更のサポート追加
- 透明背景のサポート追加
- PHP 8.0 のサポート停止(PHP 8.1 以降で利用可)
▼構成面
- Intervention/image v3 にバージョンアップ
- GitHub Workflowの追加(開発用)
- 静的解析導入(PHPStan/PHPMD/PHPCS)
- PSR12対応
- examples追加
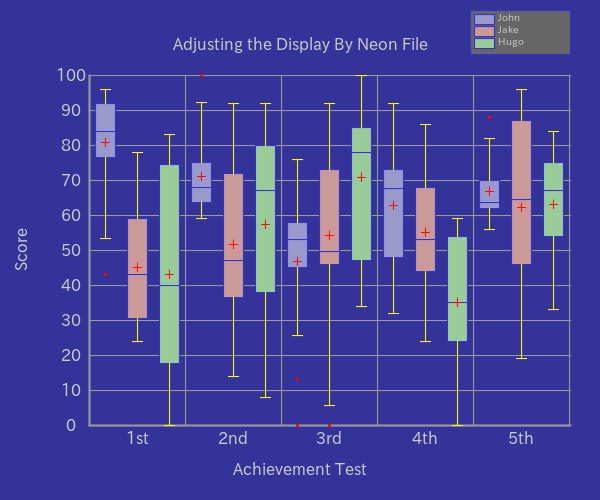
Neonファイルによる設定変更
次のようにNeonファイル「examples/AdjustDisplayByNeon.neon」を保存します。
※行頭の # はコメントです。
# Configuration for BoxplotExample.php

dataSet:
    'John': [
        1st: [75, 82, 96, 43, 78, 91, 84, 87, 93]
        2nd: [66, 74, 62, 100, 72, 68, 59, 76, 65]
        3rd: [56, 0, 45, 76, 58, 52, 13, 48, 54, 68]
        4th: [68, 32, 56, 92, 67, 72, 45, 76, 48, 73]
        5th: [70, 58, 62, 88, 62, 68, 56, 63, 64, 78]
    ]
    'Jake': [
        'test#1': [62, 35, 48, 43, 56, 78, 32, 24, 29]
        'test#2': [37, 92, 56, 36, 14, 86, 41, 58, 47]
        'test#3': [49, 83, 0, 48, 64, 73, 50, 46, 38, 92]
        'test#4': [53, 44, 34, 51, 74, 68, 53, 86, 24, 66]
        'test#5': [83, 61, 55, 96, 87, 46, 21, 19, 88, 68]
    ]
    'Hugo': [
        'test01': [73, 36, 0, 11, 40, 76, 24, 46, 83]
        'test02': [69, 42, 76, 8, 92, 84, 45, 34, 67]
        'test03': [100, 46, 34, 77, 85, 47, 91, 85, 66, 79]
        'test04': [0, 14, 32, 24, 54, 44, 56, 32, 59, 38]
        'test05': [69, 84, 65, 42, 33, 80, 74, 54, 75, 56]
    ]

limitUpper: 100
limitLower: 0

#canvasWidth: 600
#canvasHeight: 400
canvasBackgroundColor: '#333399'
#frameXRatio: 0.7
#frameYRatio: 0.6

axisColor: '#999999'
axisWidth: 2

#gridColor: '#cccccc'
#gridWidth: 1

gridHeightPitch: 10
gridVertical: true

#boxWidth: 20
#boxBackgroundColors:
#    - '#9999cc'
#    - '#cc9999'
#    - '#99cc99'
#    - '#99cccc'
#    - '#cc6666'
#    - '#ffcc99'
#    - '#cccc99'
#    - '#cc99cc'
#boxBorderColor: '#3333cc'
#boxBorderWidth: 1

whiskerColor: '#ffff00'
#whiskerWidth: 1

#fontPath: 'fonts/ipaexg.ttf' # IPA ex Gothic 00401
#fontSize: 16
fontColor: '#cccccc'

outlier: true
#outlierDiameter: 2
#outlierColor: '#ff0000'

#jitter: true
#jitterColor: '#009900'
#jitterDiameter: 2

mean: true
#meanColor: '#ff0000'

#labels: [ '1st', '2nd', '3rd', '4th', '5th' ]
labelX: 'Achievement Test'
labelY: 'Score'
caption: 'Adjusting the Display By Neon File'

legend: true
legendBackgroundColor: '#666666'
#legends: [ 'John', 'Jake', 'Hugo', ]
legendWidth: 100
legendFontSize: 10

# Default Color Set
#colors:
#    - '#9999cc'
#    - '#cc9999'
#    - '#99cc99'
#    - '#99cccc'
#    - '#cc6666'
#    - '#ffcc99'
#    - '#cccc99'
#    - '#cc99cc'
次のようにPHPコードを作成します。
<?php

require_once('../vendor/autoload.php');

use Macocci7\PhpBoxplot\Boxplot;

$bp = new Boxplot();
$bp->config('AdjustDisplayByNeon.neon')
   ->create('img/AdjustDisplayByNeon.png');
PHPコードを実行すると次のような画像が生成されます。
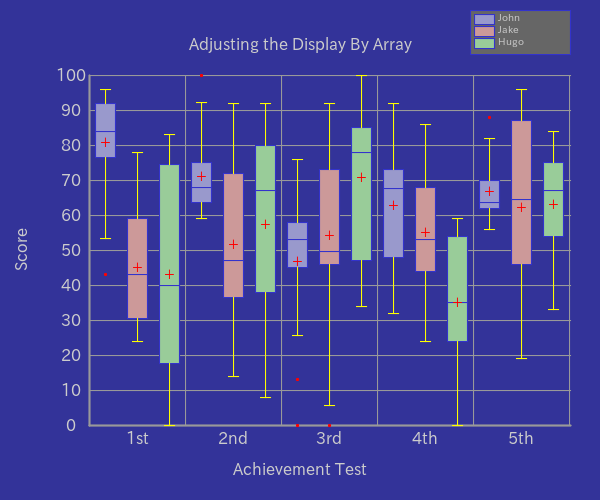
配列による設定変更
上記のような設定変更が配列を使っても可能です。
<?php

require_once('../vendor/autoload.php');

use Macocci7\PhpBoxplot\Boxplot;

$conf = [
    'dataSet' => [
        'John' => [
            '1st' => [75, 82, 96, 43, 78, 91, 84, 87, 93, ],
            '2nd' => [66, 74, 62, 100, 72, 68, 59, 76, 65, ],
            '3rd' => [56, 0, 45, 76, 58, 52, 13, 48, 54, 68, ],
            '4th' => [68, 32, 56, 92, 67, 72, 45, 76, 48, 73, ],
            '5th' => [70, 58, 62, 88, 62, 68, 56, 63, 64, 78, ],
        ],
        'Jake' => [
            'test#1' => [62, 35, 48, 43, 56, 78, 32, 24, 29, ],
            'test#2' => [37, 92, 56, 36, 14, 86, 41, 58, 47, ],
            'test#3' => [49, 83, 0, 48, 64, 73, 50, 46, 38, 92, ],
            'test#4' => [53, 44, 34, 51, 74, 68, 53, 86, 24, 66, ],
            'test#5' => [83, 61, 55, 96, 87, 46, 21, 19, 88, 68, ],
        ],
        'Hugo' => [
            'test01' => [73, 36, 0, 11, 40, 76, 24, 46, 83, ],
            'test02' => [69, 42, 76, 8, 92, 84, 45, 34, 67, ],
            'test03' => [100, 46, 34, 77, 85, 47, 91, 85, 66, 79, ],
            'test04' => [0, 14, 32, 24, 54, 44, 56, 32, 59, 38, ],
            'test05' => [69, 84, 65, 42, 33, 80, 74, 54, 75, 56, ],
        ],
    ],
    'limitUpper' => 100,
    'limitLower' => 0,
    'canvasBackgroundColor' => '#333399',
    'axisColor' => '#999999',
    'axisWidth' => 2,
    'gridHeightPitch' => 10,
    'gridVertical' => true,
    'whiskerColor' => '#ffff00',
    'fontColor' => '#cccccc',
    'outlier' => true,
    'mean' => true,
    'labelX' => 'Achievement Test',
    'labelY' => 'Score',
    'caption' => 'Adjusting the Display By Array',
    'legend' => true,
    'legendBackgroundColor' => '#666666',
    'legendWidth' => 100,
    'legendFontSize' => 10,
];

$bp = new Boxplot();
$bp->config($conf)
   ->create('img/AdjustDisplayByArray.png');
▼実行結果
Neonファイルによる設定変更と、配列による設定変更は併せて利用可能です。
設定項目は必要なものだけに絞って設定可能です。
複数回設定変更することで設定の上書きが可能です。
透明背景
「canvasBackgroundColor」の値を「null」に設定することで背景を透明にすることができます。
▼PHP
<?php

require_once('../vendor/autoload.php');

use Macocci7\PhpBoxplot\Boxplot;

$data = [
    '1st' => [75, 82, 96, 43, 78, 91, 84, 87, 93],
    '2nd' => [66, 74, 62, 100, 72, 68, 59, 76, 65],
    '3rd' => [56, 0, 45, 76, 58, 52, 13, 48, 54, 68],
    '4th' => [68, 32, 56, 92, 67, 72, 45, 76, 48, 73],
    '5th' => [70, 58, 62, 88, 62, 68, 56, 63, 64, 78],
];

$bp = new Boxplot();

$bp->setData($data)
   ->config([
    // This results in Transparent Background
    'canvasBackgroundColor' => null,
   ])
   ->limit(0, 100)
   ->gridHeightPitch(10)
   ->gridVerticalOn()
   ->outlierOn()
   ->meanOn()
   ->labelX('Examination')
   ->labelY('Score')
   ->caption('Transparent Background')
   ->create('img/TransparentBackground.png');
▼実行結果
以上です。
- 0
- 0
- 0
- 0
コメント