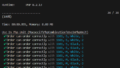
以前作成したPHPライブラリの散布図作成ツール PHP-Scatterplot を Version 1.1.1 にアップデートしました。
GitHub - macocci7/PHP-Scatterplot: PHP-Scatterplot is a simple PHP library to create scatter plot easily.
PHP-Scatterplot is a simple PHP library to create scatter plot easily. - macocci7/PHP-Scatterplot
github.com
インストールの仕方、基本的な使い方については、以前の記事をご覧ください。
主な変更点
▼機能面
- Neonファイルによる設定変更のサポート追加
- 配列による設定変更のサポート追加
- 透明背景のサポート追加
- PHP 8.0 のサポート停止(PHP 8.1以降で利用可)
▼構成面
- Intervention/image v3 にバージョンアップ
- GitHub Workflow の追加(開発用)
- 静的解析導入(PHPStan/PHPMD/PHPCS)
- PSR12対応
- examples追加
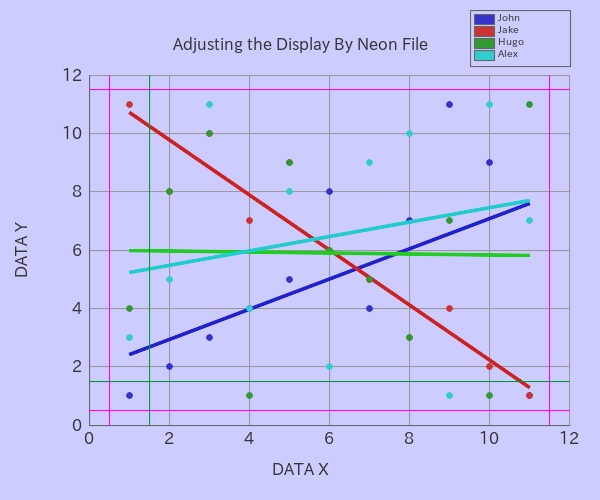
Neonファイルによる設定変更
次のようにNeonファイル「examples/AdjustDisplayByNeon.neon」を保存します。
#canvasWidth: 600
#canvasHeight: 500
canvasBackgroundColor: '#ccccff'
#frameXRatio: 0.8
#frameYRatio: 0.7
#axisColor: '#666666'
#axisWidth: 1
gridColor: '#999999'
#gridWidth: 1
gridXPitch: 2
gridYPitch: 2
gridX: true
gridY: true
xLimitUpper: 12
xLimitLower: 0
yLimitUpper: 12
yLimitLower: 0
plotDiameter: 6
#fontPath: 'fonts/ipaexg.ttf' # IPA ex Gothic 00401
#fontSize: 16
#fontColor: '#333333'
referenceLineX: true
referenceLineXValue: 1.5
referenceLineXWidth: 1
referenceLineXColor: '#009933'
referenceLineY: true
referenceLineYValue: 1.5
referenceLineYWidth: 1
referenceLineYColor: '#009933'
specificationLimitX: true
specificationLimitXLower: 0.5
specificationLimitXUpper: 11.5
specificationLimitXWidth: 1
specificationLimitXColor: '#ff00ff'
specificationLimitY: true
specificationLimitYLower: 0.5
specificationLimitYUpper: 11.5
specificationLimitYWidth: 1
specificationLimitYColor: '#ff00ff'
regressionLine: true
regressionLineWidth: 3
labelX: 'DATA X'
labelY: 'DATA Y'
caption: 'Adjusting the Display By Neon File'
legend: true
legends: [ 'John', 'Jake', 'Hugo', 'Alex', ]
legendWidth: 100
legendFontSize: 10
colors:
    - '#3333cc'
    - '#cc3333'
    - '#339933'
    - '#33cccc'
    - '#cc3333'
    - '#ffcc33'
    - '#cccc33'
    - '#cc33cc'
regressionLineColors:
    - '#2222cc'
    - '#cc2222'
    - '#22cc22'
    - '#22cccc'
次のようにPHPコードを作成します。
<?php

require('../vendor/autoload.php');

use Macocci7\PhpScatterplot\Scatterplot;

$layers = [
    'John' => [
        'x' => [ 1, 2, 3, 4, 5, 6, 7, 8, 9, 10, 11, ],
        'y' => [ 1, 2, 3, 4, 5, 8, 4, 7, 11, 9, 1, ],
    ],
    'Jake' => [
        'x' => [ 1, 2, 3, 4, 5, 6, 7, 8, 9, 10, 11, ],
        'y' => [ 11, 8, 10, 7, 9, 6, 5, 3, 4, 2, 1, ],
    ],
    'Hugo' => [
        'x' => [ 1, 2, 3, 4, 5, 6, 7, 8, 9, 10, 11, ],
        'y' => [ 4, 8, 10, 1, 9, 6, 5, 3, 7, 1, 11, ],
    ],
    'Alex' => [
        'x' => [ 1, 2, 3, 4, 5, 6, 7, 8, 9, 10, 11, ],
        'y' => [ 3, 5, 11, 4, 8, 2, 9, 10, 1, 11, 7, ],
    ],
];

$sp = new Scatterplot();
$sp->layers($layers)
   ->config('AdjustDisplayByNeon.neon')
   ->create('img/AdjustDisplayByNeon.png');
PHPコードを実行すると、次のような画像が生成されます。
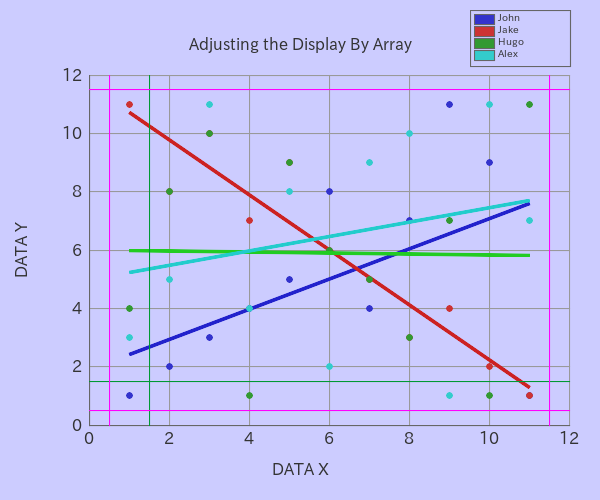
配列による設定変更
上記のような設定変更が、配列を使って行うことができます。
<?php

require('../vendor/autoload.php');

use Macocci7\PhpScatterplot\Scatterplot;

$layers = [
    'John' => [
        'x' => [ 1, 2, 3, 4, 5, 6, 7, 8, 9, 10, 11, ],
        'y' => [ 1, 2, 3, 4, 5, 8, 4, 7, 11, 9, 1, ],
    ],
    'Jake' => [
        'x' => [ 1, 2, 3, 4, 5, 6, 7, 8, 9, 10, 11, ],
        'y' => [ 11, 8, 10, 7, 9, 6, 5, 3, 4, 2, 1, ],
    ],
    'Hugo' => [
        'x' => [ 1, 2, 3, 4, 5, 6, 7, 8, 9, 10, 11, ],
        'y' => [ 4, 8, 10, 1, 9, 6, 5, 3, 7, 1, 11, ],
    ],
    'Alex' => [
        'x' => [ 1, 2, 3, 4, 5, 6, 7, 8, 9, 10, 11, ],
        'y' => [ 3, 5, 11, 4, 8, 2, 9, 10, 1, 11, 7, ],
    ],
];

$conf = [
    //'canvasWidth' => 600,
    //'canvasHeight' => 500,
    'canvasBackgroundColor' => '#ccccff',
    //'frameXRatio' => 0.8,
    //'frameYRatio' => 0.7,
    //'axisColor' => '#666666',
    //'axisWidth' => 1,
    'gridColor' => '#999999',
    //'gridWidth' => 1,
    'gridXPitch' => 2,
    'gridYPitch' => 2,
    'gridX' => true,
    'gridY' => true,
    'xLimitUpper' => 12,
    'xLimitLower' => 0,
    'yLimitUpper' => 12,
    'yLimitLower' => 0,
    'plotDiameter' => 6,
    //'fontPath' => 'fonts/ipaexg.ttf', // IPA ex Gothic 00401
    //'fontSize' => 16,
    //'fontColor' => '#333333',
    'referenceLineX' => true,
    'referenceLineXValue' => 1.5,
    'referenceLineXWidth' => 1,
    'referenceLineXColor' => '#009933',
    'referenceLineY' => true,
    'referenceLineYValue' => 1.5,
    'referenceLineYWidth' => 1,
    'referenceLineYColor' => '#009933',
    'specificationLimitX' => true,
    'specificationLimitXLower' => 0.5,
    'specificationLimitXUpper' => 11.5,
    'specificationLimitXWidth' => 1,
    'specificationLimitXColor' => '#ff00ff',
    'specificationLimitY' => true,
    'specificationLimitYLower' => 0.5,
    'specificationLimitYUpper' => 11.5,
    'specificationLimitYWidth' => 1,
    'specificationLimitYColor' => '#ff00ff',
    'regressionLine' => true,
    'regressionLineWidth' => 3,
    'labelX' => 'DATA X',
    'labelY' => 'DATA Y',
    'caption' => 'Adjusting the Display By Array',
    'legend' => true,
    'legends' => [ 'John', 'Jake', 'Hugo', 'Alex', ],
    'legendWidth' => 100,
    'legendFontSize' => 10,
    'colors' => [
        '#3333cc',
        '#cc3333',
        '#339933',
        '#33cccc',
        '#cc3333',
        '#ffcc33',
        '#cccc33',
        '#cc33cc',
    ],
    'regressionLineColors' => [
        '#2222cc',
        '#cc2222',
        '#22cc22',
        '#22cccc',
    ],
];

$sp = new Scatterplot();
$sp->layers($layers)
   ->config($conf)
   ->create('img/AdjustDisplayByArray.png');
PHPコードを実行すると、次のような画像が生成されます。
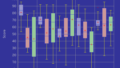
透明背景
「canvasBackgroundColor」の値を「null」にすることで
背景を透明にすることができます。
<?php

require('../vendor/autoload.php');

use Macocci7\PhpScatterplot\Scatterplot;

$layers = [
    'John' => [
        'x' => [ 1, 2, 3, 4, 5, 6, 7, 8, 9, 10, 11, ],
        'y' => [ 1, 2, 3, 4, 5, 8, 4, 7, 11, 9, 1, ],
    ],
    'Jake' => [
        'x' => [ 1, 2, 3, 4, 5, 6, 7, 8, 9, 10, 11, ],
        'y' => [ 11, 8, 10, 7, 9, 6, 5, 3, 4, 2, 1, ],
    ],
    'Hugo' => [
        'x' => [ 1, 2, 3, 4, 5, 6, 7, 8, 9, 10, 11, ],
        'y' => [ 4, 8, 10, 1, 9, 6, 5, 3, 7, 1, 11, ],
    ],
    'Alex' => [
        'x' => [ 1, 2, 3, 4, 5, 6, 7, 8, 9, 10, 11, ],
        'y' => [ 3, 5, 11, 4, 8, 2, 9, 10, 1, 11, 7, ],
    ],
];

$sp = new Scatterplot();
$sp->layers($layers)
   ->config('AdjustDisplayByNeon.neon')
   ->config([
    // This results in transparent backgournd
    'canvasBackgroundColor' => null,
   ])
   ->create('img/TransparentBackground.png');
PHPコードを実行すると、次のような画像が生成されます。
以上です。
- 0
- 0
- 0
- 0
コメント